Gantt charts
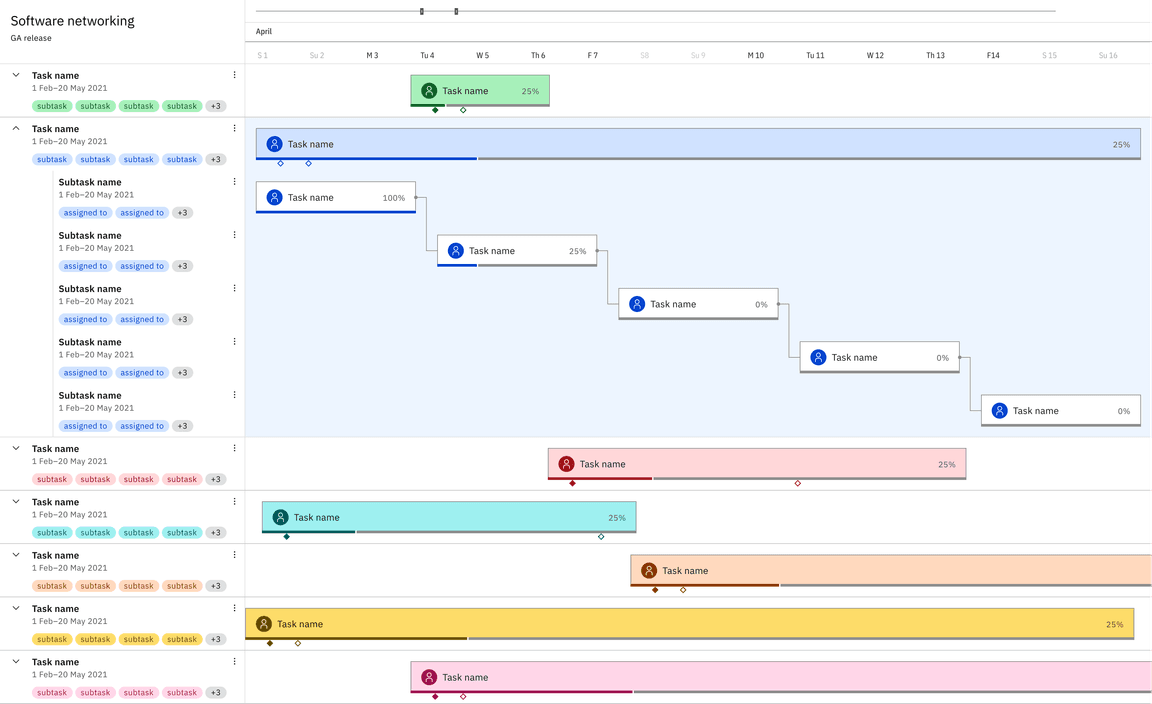
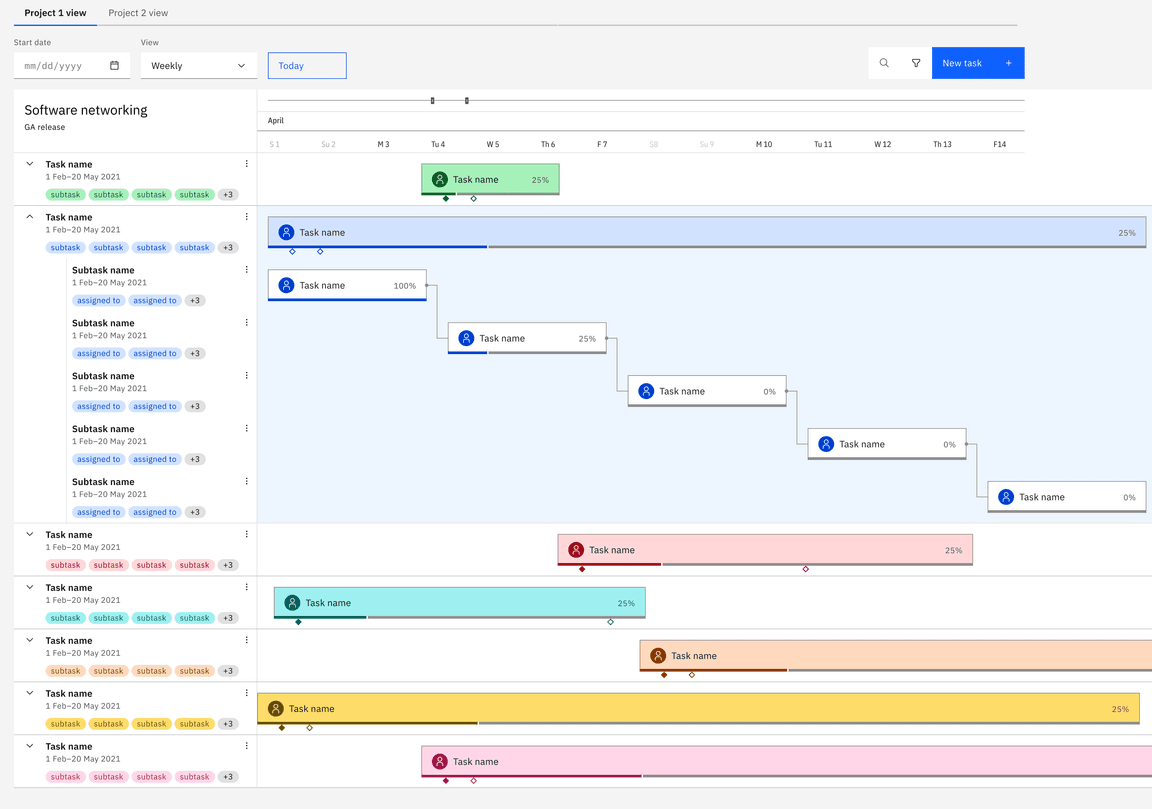
A Gantt chart is a project management tool that illustrates work completed over a period of time in relation to the time planned for the work. It typically includes two sections: the left side outlines a list of tasks, while the right side has a timeline with schedule bars that visualize work.
Resources
Card Component
Card lies on the y-axis of the Gantt chart, the cards are used to show any additional information about the task bar. Cards can expand to include sub cards that have the details of a sub task.
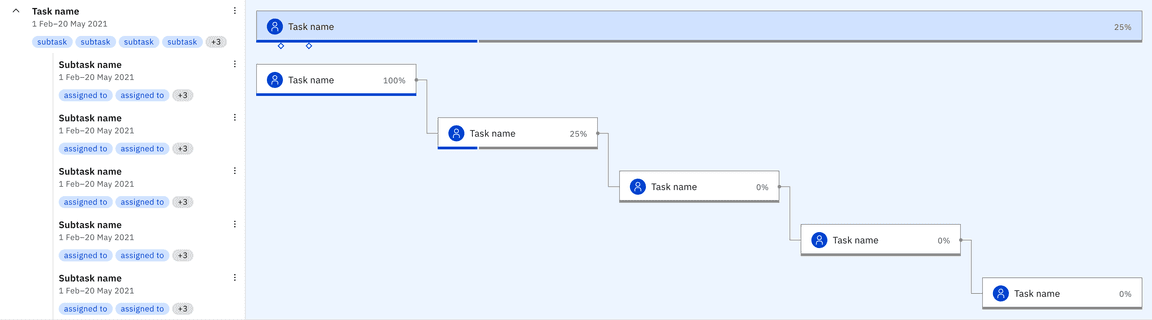
Task component
A visual representation of an action that is tracked across time on a gantt chart. It depicts the action relative to time it will take complete and when to start.
Design recommendations
When designing the Gantt chart make sure to arrange task bars with contrasting colors next to each other and similar colors away from each other. Tasks should have a clear title and all users who are assigned listed in the card.
Contributors
We would like to extend our heartfelt gratitude to our contributors who developed these specifications. Their dedication and expertise have been instrumental in bringing these insightful resources to fruition.
- Amaya Mali
- Valerie Garza
- Dana Paslaru
- Juan Encalada